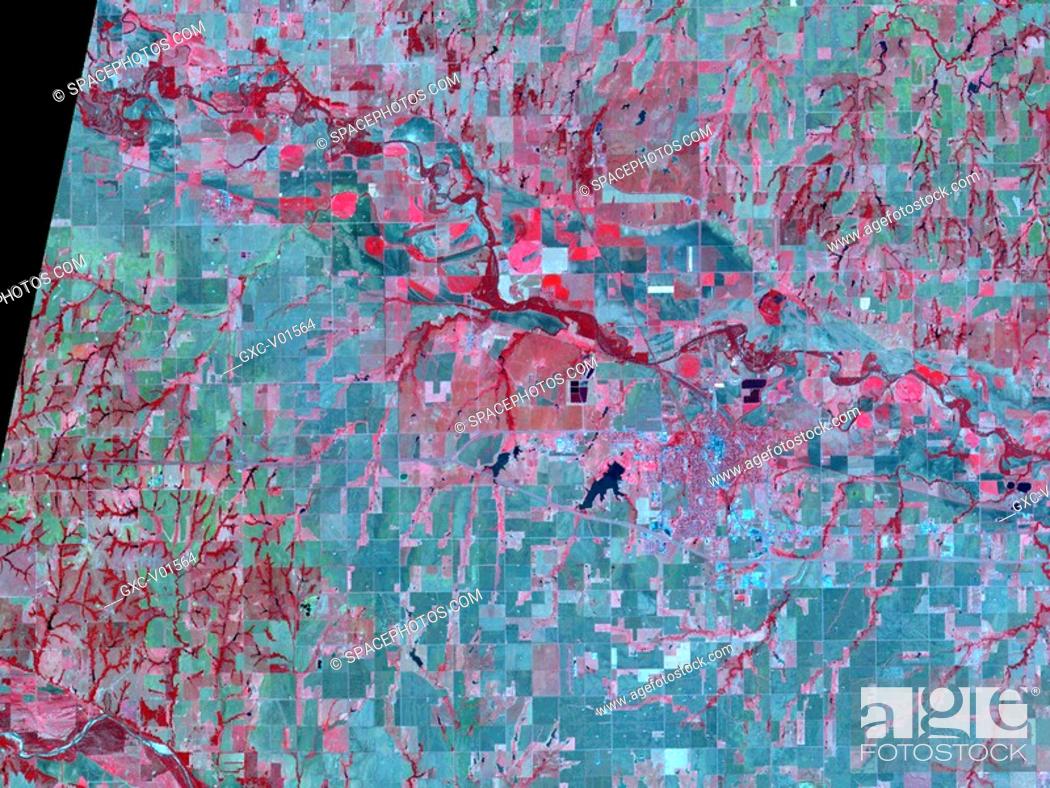
Stock Photo - On September 4, 2000, the satellite acquired these multi_spectral data over the U.S. Department of Agriculture´s Grazing Lands Research Laboratory near El Reno, Oklahoma. This series of false_color composite images demonstrates some of the many remote_sensing measurements that scientists can make with high_resolution up to 15 square meters per pixel, multi_spectral data. In the top image, bright red colors indicate green vegetation, which at this time of year only includes irrigated lands and riparian zones. Gray_green colors represent harvested winter wheat fields. Dendritic drainage patterns are clearly depicted in the lower left and upper right portions of the scene. The second two images show that there is a strong correlation between the abundance of green vegetation referred to as Normalized Difference Vegetation Index, or NDVI and land surface temperature. Vegetated areas have NDVI values of greater than 0.3 blue and green pixels and are relatively cool 315_320 Kelvin. Bare soil surfaces have NDVI values close to zero orange and yellow and are relatively hot 325_330 Kelvin. Water bodies have a very low NDVI of _0.2 red and cool temperatures of about 300_305 Kelvin blue. The fourth and fifth images represent components of the surface energy balance over the region at 11:30 a.m. local time. Surface energy balance shows the relationship between incoming solar energy, energy absorbed by the surface, and energy reflected or emitted from the surface back up into the overlying atmosphere. These images provide insights into the complex processes of direct radiation, conduction, and convection that are important for scientists in studies of both weather patterns and the water cycle. The fourth image shows sensible heat and the fifth image shows latent heat, which represents energy flowing from the Earth´s surface into the atmospheric boundary layer. Sensible heat is energy flow due to temperature gradients, while latent heat is energy flow due to evapotranspiration. The Team derives sensible and latent heat by combining measurements of surface temperature and vegetation abundance NDVI with surface meteorological measurements. Together, they show that heat flow from bare fields is dominated by sensible heat, while heat flow from vegetated areas and water bodies is dominated by latent heat. The latent heat flux measurements derived from data can be converted into rates of evaporation, shown in the sixth image, and is therefore a direct measure of water lost to the atmosphere. Before thermal infrared satelllite imagery became available, spatial changes in evaporation could not be measured.

Stock Photo: On September 4, 2000, the satellite acquired these multi-spectral data over the U.S. Department of Agriculture's Grazing Lands Research Laboratory near El Reno.

Searchable keywords

Choose multiple keywords